| Name | Description |
|---|---|
Chart Type |
|
| Chart Title | Chart Title to be displayed part of the generated graph. |
| Data Binder | When Datasource is set to "Using Data Binder", this option will show up. Please see Datalist Binder for available binder to use. |

| Name | Description |
|---|---|
Order By | Column to be sorted in the graph dataset. This would affect how the graph is plotted. |
| Order |
|
| X-axis Value | X-axis label. |
| Y-axis Values | Y-axis dataset. |
| Date Data Format | this is not in userview chart |

| Name | Description | |||||||||||||||
|---|---|---|---|---|---|---|---|---|---|---|---|---|---|---|---|---|
X-axis Label | X-axis Label | |||||||||||||||
| X-axis display as |
| |||||||||||||||
| Y-axis Label | Y-axis Label | |||||||||||||||
| Y-axis Prefix | Y-axis Prefix | |||||||||||||||
| Show Legend? | If checked, legend will be shown in the generated graph. | |||||||||||||||
| Width (px) | Width in character.
| |||||||||||||||
| Height (px) | Height in character.
| |||||||||||||||
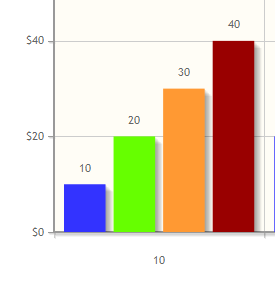
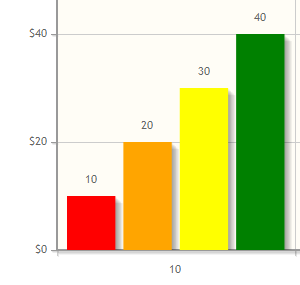
| Colors | Series color. Optional field. Comma separated values (CSV) of color codes. Example:
| |||||||||||||||
| Alignment |
| |||||||||||||||
| Margin Bottom |